Onboarding Checklist Shows 5 Steps and 61% Quit at Step 2
Most onboarding drop-off happens at step two, where the promise meets real work, revealing a design signal worth understanding
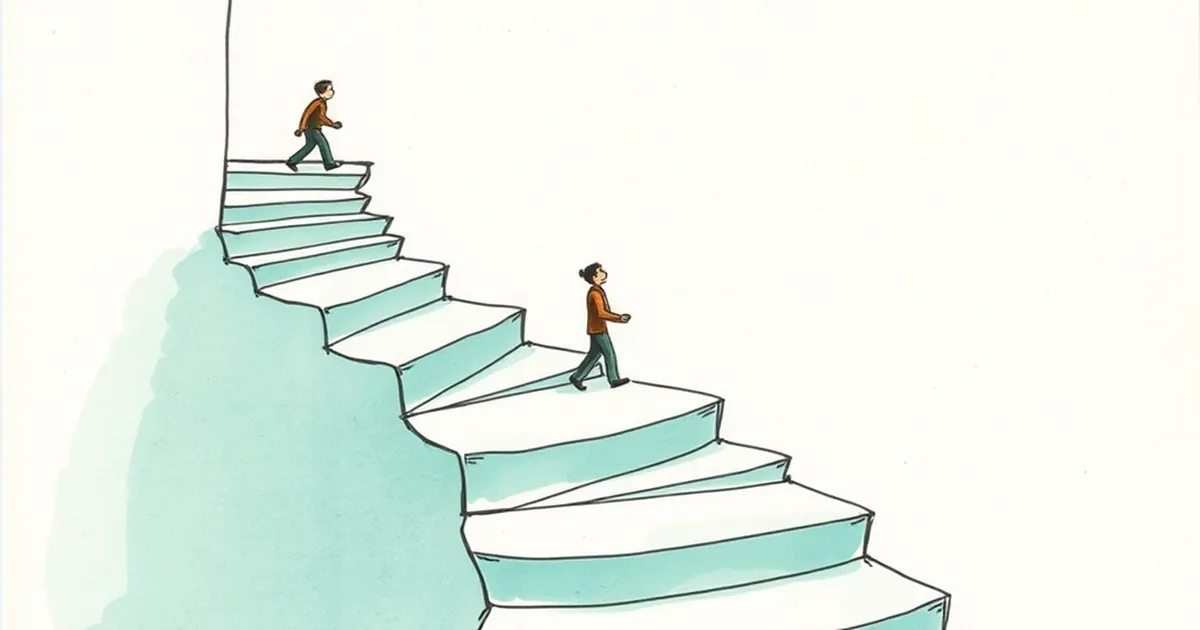
You've built the checklist. Five neat steps, progress bar, confetti at the end. Then the analytics come back and 61% of people vanish at step two. Not step one, where you'd expect the curious to bounce. Step two. That number is a design signal, and it's also a behavior signal — people are making a decision about your product at a moment you probably didn't design on purpose.
Step Two Is Where the Promise Meets the Work
Step one is almost always cheap. Connect an account, pick a template, name your project. Step two is where you ask for something real: import your data, invite a teammate, configure a setting you don't understand yet. The user arrived with a vague promise ("get organized") and hit a concrete cost. That gap is where quitting happens.
Behavioral research calls the mental accounting here loss aversion — people weigh a loss more heavily than an equivalent gain, roughly twice as much in Kahneman and Tversky's classic framing. At step two, the user isn't weighing "what I gain by finishing" against "what I lose by stopping." They're weighing the effort they've already spent against the effort still ahead, and the second number looks bigger. The checklist you designed as motivation becomes a receipt for sunk cost.
The Progress Bar Is Lying About the Cost
A five-step bar implies each step costs the same. It doesn't. If step two takes four minutes and step four takes forty seconds, your bar is a false promise, and users feel the mismatch immediately. This is where variable-ratio thinking gets misapplied — some onboarding flows add surprise rewards at random steps to keep people pulling the lever. It works on engagement metrics and it corrodes trust, because the user can't predict what finishing actually requires.
The fix is honesty. Show time estimates per step, or collapse the heavy step into an optional branch. If importing data is the real work, label it "about 3 minutes" and let people skip it and come back. Uncertainty about cost is what kills completion, not the cost itself.
One Study Worth Knowing
The clearest reference point here is the classic goal-gradient work by Kivetz, Urminsky, and Zheng on coffee card loyalty programs. People sped up as they got closer to a reward — effort increased near the finish line, not at the start. Onboarding rarely has a finish line users can feel, so the gradient never kicks in. Your step two is the flat middle of the curve, and the middle is where people stop.
Design the Decision, Not Just the Screen
Ask what decision the user is actually making at step two. Usually it's one of three: "Is this worth my time," "Do I trust this with my data," or "Will my team judge me for setting this up wrong." Each has a different design answer. The first needs a faster path to visible value. The second needs plain language about what happens to their information. The third needs a preview of what the finished setup looks like, so they can see the outcome before paying the cost.
What to Instrument Next
Before you redesign anything, split that 61% into two groups: people who saw step two and left, and people who saw it, started it, and abandoned mid-task. Those are different problems with different fixes. The first is a promise problem. The second is a friction problem.
Then run a small experiment: move the heavy step to the end, or make it optional, and watch whether completion climbs or just shifts. The interesting question isn't whether you can get more people to step five. It's whether the ones who arrive there actually use the product a week later. Completion is a proxy. Retention is the thing you're actually designing for, and step two is where you find out which one you've been optimizing.
— creative mess